North American Rotary
Rig Counts
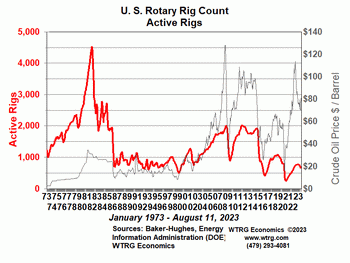
The U.S.
rotary rig count from Baker Hughes was down 5
at 654 for the week of August 11, 2023. It is
109 rigs (14.3%) lower than
last year.
The
number of rotary rigs drilling for oil is
unchanged at 525. There are 76 fewer rigs
targeting oil than last year. Rigs drilling for
oil are 80.3 percent of all
drilling activity.
Rigs
targeting natural gas were down 5 at 123. The
number of rigs drilling for gas is 37 lower
than last year.
Unspecified
or miscellaneous rig count is unchanged at 6
and is 4 higher than last year.
Year-over-year
oil
exploration in the U.S. is down 12.6 percent. Gas
exploration is down 23.1 percent. The weekly
average of crude oil spot price is 9.6 percent lower
than last year and natural
gas spot prices are 66.5 percent lower than last
year. See Oil
Futures Price Goes Negative.
Daily crude oil and
natural gas futures and spot prices are
available on our site.
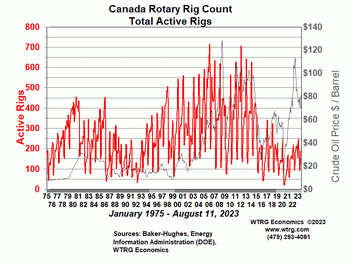
Canadian rig
activity was up 2 at 190 for the week of
August 11, 2023 and is 11 (5.5%) lower than
last year. Rigs targeting oil
were down 2 at 116 and are 21 (15.3%)
lower than last year. Gas directed rig count
at 74 is up 4 for the week and is up 10
(15.6%) from last year.
Miscellaneous rig count was unchanged at 0.
Canadian drilling falls rapidly in the spring
to avoid environmental damage from moving
drilling equipment during the spring thaw and
rainy season. With large
weather related seasonal swings, even
year-over-year comparisons can lead to
incorrect conclusions. Also, Canadians seem to
take their holidays more serious than their
counterparts in the U.S. and rig count usually
drops near holidays.
North American Rig Count
|
Change
|
Percent Change |
|
08/11/2023 |
08/04/2023 |
08/12/2022 |
Weekly |
Annual |
Weekly |
Annual |
| Total U.S. |
654 |
659 |
763 |
(5) |
(109) |
-0.8% |
-14.3% |
| Offshore |
18 |
19 |
18 |
(1) |
0 |
-5.3% |
0.0% |
| Land |
636 |
640 |
745 |
(4) |
(109) |
-0.6% |
-14.6% |
| Inland
Waters |
4 |
5 |
3 |
(1) |
1 |
-20.0% |
33.3% |
| Oil |
525 |
525 |
601 |
0 |
(76) |
0.0% |
-12.6% |
| Percent |
80.3% |
79.7% |
78.8% |
0.6% |
1.5% |
|
|
| Gas |
123 |
128 |
160 |
(5) |
(37) |
-3.9% |
-23.1% |
| Percent |
18.8% |
19.4% |
21.0% |
-0.6% |
-2.2% |
|
|
| Miscellaneous
|
6 |
6 |
2 |
0 |
4 |
|
|
| Percent |
0.9% |
0.9% |
0.3% |
0.0% |
0.7% |
|
|
| Directional |
53 |
53 |
39 |
0 |
14 |
0.0% |
35.9% |
| Horizontal |
579 |
585 |
693 |
-6 |
-114 |
-1.0% |
-16.5% |
| Vertical |
22 |
21 |
31 |
1 |
-9 |
4.8% |
-29.0% |
| Gulf of Mexico |
17 |
18 |
16 |
-1 |
1 |
-5.6% |
6.3% |
| Gulf Oil |
17 |
18 |
16 |
-1 |
1 |
-5.6% |
6.3% |
| Percent |
100.0% |
100.0% |
100.0% |
0.0% |
0.0% |
|
|
| Gulf Gas |
0 |
0 |
0 |
0 |
0 |
n.a. |
n.a. |
| Percent |
0.0% |
0.0% |
0.0% |
0.0% |
0.0% |
|
|
| Canada |
190 |
188 |
201 |
2 |
(11) |
1.1% |
-5.5% |
| Oil |
116 |
118 |
137 |
(2) |
(21) |
-1.7% |
-15.3% |
| Percent |
61.1% |
62.8% |
68.2% |
-1.7% |
-7.1% |
|
|
| Gas |
74 |
70 |
64 |
4 |
10 |
5.7% |
15.6% |
| Percent |
38.9% |
37.2% |
31.8% |
1.7% |
7.1% |
|
|
| North America |
844 |
847 |
964 |
(3) |
(120) |
-0.4% |
-12.4% |
| Prices |
|
|
|
|
|
|
|
| Oil $/bbl. |
$83.05 |
$81.40 |
$91.92 |
$1.65 |
($8.87) |
2.0% |
-9.6% |
| Oil $/mmbtu |
$14.32 |
$14.03 |
$15.85 |
$0.29 |
($1.53) |
2.0% |
-9.6% |
| Gas $/mmbtu |
$2.73 |
$2.49 |
$8.15 |
$0.24 |
($5.42) |
9.5% |
-66.5% |
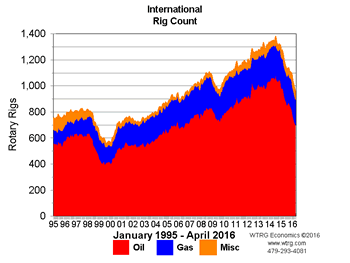
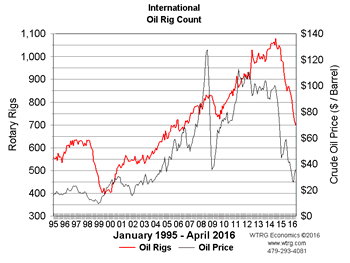
Monthly: International
Rig Counts
