|
|||||||||||||||||||||||||||||||||||
If
you find this history useful you may wish to subscribe to WTRG
Economics'
Energy Economist Newsletter
Oil Price History and Analysis
Like prices of other commodities the price of crude oil experiences wide price swings in times of shortage or oversupply. The crude oil price cycle may extend over several years responding to changes in demand as well as OPEC and non-OPEC supply. We will discuss the impact of geopolitical events, supply demand and stocks as well as NYMEX trading and the economy.
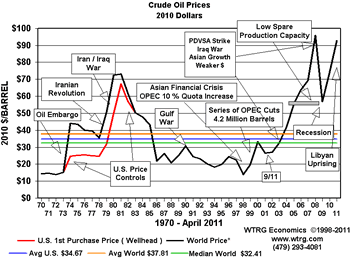
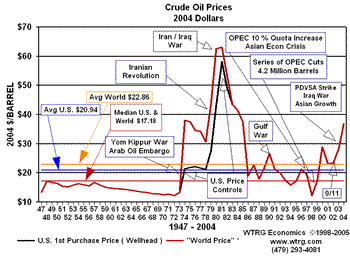
Throughout much of the twentieth century, the price of U.S. petroleum was heavily regulated through production or price controls. In the post World War II era, U.S. oil prices at the wellhead averaged $28.52 per barrel adjusted for inflation to 2010 dollars. In the absence of price controls, the U.S. price would have tracked the world price averaging near $30.54. Over the same post war period, the median for the domestic and the adjusted world price of crude oil was $20.53 in 2010 prices. Adjusted for inflation, from 1947 to 2010 oil prices only exceeded $20.53 per barrel 50 percent of the time. (See note in the box on right.)
Until March 28, 2000 when OPEC adopted the $22-$28 price band for the OPEC basket of crude, real oil prices only exceeded $30.00 per barrel in response to war or conflict in the Middle East. With limited spare production capacity, OPEC abandoned its price band in 2005 and was powerless to stem a surge in oil prices, which was reminiscent of the late 1970s.
Click on graph for larger view
| *World Price - The only very long term price series that exists is the U.S. average wellhead or first purchase price of crude. When discussing long-term price behavior this presents a problem since the U.S. imposed price controls on domestic production from late 1973 to January 1981. In order to present a consistent series and also reflect the difference between international prices and U.S. prices we created a world oil price series that was consistent with the U.S. wellhead price adjusting the wellhead price by adding the difference between the refiners acquisition price of imported crude and the refiners average acquisition price of domestic crude. |
The very long-term view is similar. Since 1869, US crude oil prices adjusted for inflation averaged $23.67 per barrel in 2010 dollars compared to $24.58 for world oil prices.
Fifty percent of the time prices U.S. and world prices were below the median oil price of $24.58 per barrel.
If long-term history is a guide, those in the upstream segment of the crude oil industry should structure their business to be able to operate with a profit, below $24.58 per barrel half of the time. The very long-term data and the post World War II data suggest a "normal" price far below the current price. However, the rise of OPEC, which replaced the Texas Railroad Commission as the monitor of spare production capacity, together with increased interest in oil futures as an asset class introduced changes that support prices far higher than the historical "norm.”
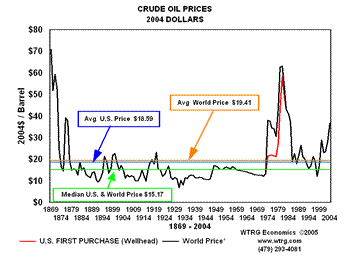
Click on graph for larger view
The results are dramatically different if only post-1970 data are used. In that case, U.S. crude oil had an average price of $34.77 per barrel. The more relevant world oil price averaged $37.93 per barrel. The median oil price for that period is $32.50 per barrel.
If oil prices revert to the mean this period is a little more appropriate for today's analyst. It follows the peak in U.S. oil production eliminating the effects of the Texas Railroad Commission which effectively controlled oil prices prior to 1970. It is a period when the Seven Sisters were no longer able to dominate oil production and prices and an era of greater influence for OPEC oil producers. As we will see in the detail below, influence over the price of oil is not equivalent to control.
Prices in the mid $30s seem exceptionally low by today's standards. However, when the current President of the United States took office the price was $35.00 per barrel. By the end of 2009 prices had doubled bringing the average for 2009 to $56.35 or $57.00 in 2010$.
Crude Oil Prices 1970 - October 2011
Click on graph for larger view
Pre-Embargo Period
From 1948 through the end of the 1960s, crude oil prices ranged between $2.50 and $3.00. The price oil rose from $2.50 in 1948 to about $3.00 in 1957. When viewed in 2010 dollars, a different story emerges with crude oil prices fluctuating between $17 and $19 during most of the period. The apparent 20% price increase in nominal prices just kept up with inflation.From 1958 to 1970, prices were stable near $3.00 per barrel, but in real terms the price of crude oil declined from $19 to $14 per barrel. Not only was price of crude lower when adjusted for inflation, but in 1971 and 1972 the international producer suffered the additional effect of a weaker US dollar.
OPEC was established in 1960 with five founding members: Iran, Iraq, Kuwait, Saudi Arabia and Venezuela. Two of the representatives at the initial meetings previously studied the Texas Railroad Commission's method of controlling price through limitations on production. By the end of 1971, six other nations had joined the group: Qatar, Indonesia, Libya, United Arab Emirates, Algeria and Nigeria. From the foundation of the Organization of Petroleum Exporting Countries through 1972, member countries experienced steady decline in the purchasing power of a barrel of oil.
Throughout the post war period exporting countries found increased demand for their crude oil but a 30% decline in the purchasing power of a barrel of oil. In March 1971, the balance of power shifted. That month the Texas Railroad Commission set proration at 100 percent for the first time. This meant that Texas producers were no longer limited in the volume of oil that they could produce from their wells. More important, it meant that the power to control crude oil prices shifted from the United States (Texas, Oklahoma and Louisiana) to OPEC. By 1971, there was no spare production capacity in the U.S. and therefore no tool to put an upper limit on prices.
A little more than two years later, OPEC through the unintended consequence of war obtained a glimpse of its power to influence prices. It took over a decade from its formation for OPEC to realize the extent of its ability to influence the world market.
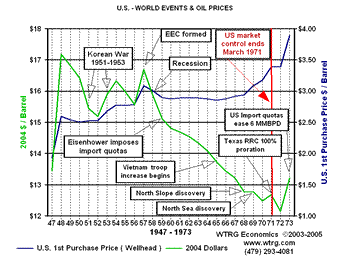 Click on graph for larger view |
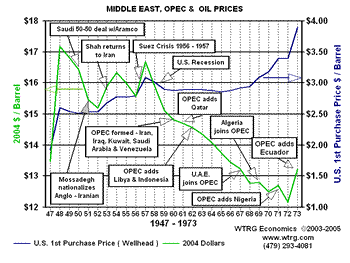 Click on graph for larger view |
Yom Kippur War - Arab Oil Embargo*
In 1972, the price of crude oil was below $3.50 per barrel. The Yom Kippur War started with an attack on Israel by Syria and Egypt on October 5, 1973. The United States and many countries in the western world showed support for Israel. In reaction to the support of Israel, several Arab exporting nations joined by Iran imposed an embargo on the countries supporting Israel. While these nations curtailed production by five million barrels per day, other countries were able to increase production by a million barrels. The net loss of four million barrels per day extended through March of 1974. It represented 7 percent of the free world production. By the end of 1974, the nominal price of oil had quadrupled to more than $12.00.Any doubt that the ability to influence and in some cases control crude oil prices had passed from the United States to OPEC was removed as a consequence of the Oil Embargo. The extreme sensitivity of prices to supply shortages, became all too apparent when prices increased 400 percent in six short months.
From 1974 to 1978, the world crude oil price was relatively flat ranging from $12.52 per barrel to $14.57 per barrel. When adjusted for inflation world oil prices were in a period of moderate decline. during that period OPEC capacity and production was relatively flat near 30 million barrels per day.
In contrast, non-OPEC production increased from 25 million barrels per day to 31 million barrels per day.
* While commonly called the Arab Oil Embargo or the OPEC Oil Embargo, neither is technically correct. Arab nations were joined by Persian Iran and founding OPEC member Venezuela did not join in the embargo.
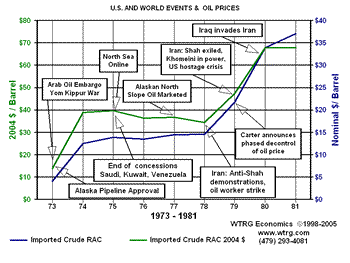
Click on graph for larger view
OPEC Oil Production 1973 - June 2011
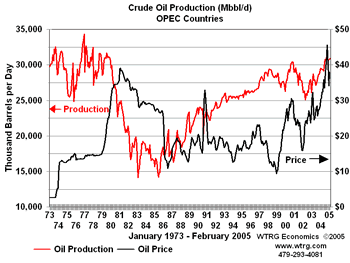
Click on graph for larger view
Non-OPEC Oil Production 1973 - June 2011
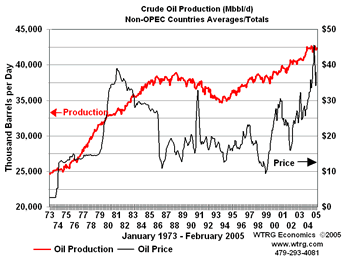
In 1979 and 1980, events in Iran and Iraq led to another round of crude oil price increases. The Iranian revolution resulted in the loss of 2.0-2.5 million barrels per day of oil production between November 1978 and June 1979. At one point production almost halted.
The Iranian revolution was the proximate cause of the highest price in post-WWII history. However, revolution's impact on prices would have been limited and of relatively short duration had it not been for subsequent events. In fact, shortly after the revolution, Iranian production was up to four million barrels per day.
In September 1980, Iran already weakened by the revolution was invaded by Iraq. By November, the combined production of both countries was only a million barrels per day. It was down 6.5 million barrels per day from a year before. As a consequence, worldwide crude oil production was 10 percent lower than in 1979.
The loss of production from the combined effects of the Iranian revolution and the Iraq-Iran War caused crude oil prices to more than double. The nominal price went from $14 in 1978 to $35 per barrel in 1981.
Over three decades later Iran's production is only two-thirds of the level reached under the government of Reza Pahlavi, the former Shah of Iran.
Iraq's production is now increasing, but remains a million barrels below its peak before the Iraq-Iran War.
Iran Oil production 1973 - June 2011
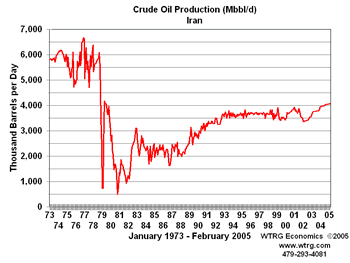
Click on graph for larger view
Iraq Oil production 1973 - June 2011
Iraq Oil production 1973 - June 2011
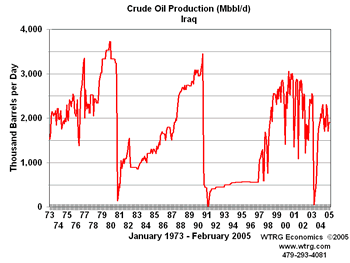
Click on graph for larger view
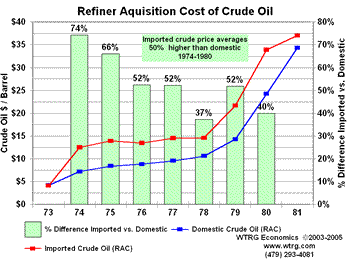
The rapid increase in crude prices from 1973 to 1981 would have been less was it not for United States energy policy during the post Embargo period. The U.S. imposed price controls on domestically produced oil. The obvious result of the price controls was that U.S. consumers of crude oil paid about 50 percent more for imports than domestic production and U.S. producers received less than world market price. In effect, the domestic petroleum industry was subsidizing the U.S. consumer.
Did the policy achieve its goal? In the short-term, the recession induced by the 1973-1974 crude oil price spike was somewhat less severe because U.S. consumers faced lower prices than the rest of the world. However, it had other effects as well.
In the absence of price controls, U.S. exploration and production would certainly have been significantly greater. Higher petroleum prices faced by consumers would have resulted in lower rates of consumption: automobiles would have achieved higher miles per gallon sooner, homes and commercial buildings would have been better insulated and improvements in industrial energy efficiency would have been greater than they were during this period. Fuel substitution away from petroleum to natural gas for electric power generation would have occurred earlier.
Consequently, the United States would have been less dependent on imports in 1979-1980 and the price increase in response to Iranian and Iraqi supply interruptions would have been significantly less.
Click on graph for larger view
OPEC has seldom been effective at controlling prices. Often described as a cartel, OPEC does not fully satisfy the definition. One of the primary requirements of a cartel is a mechanism to enforce member quotas. An elderly Texas oil man posed a rhetorical question: What is the difference between OPEC and the Texas Railroad Commission? His answer: OPEC doesn't have any Texas Rangers!
The Texas Railroad Commission could control prices because the state could enforce cutbacks on producers. The only enforcement mechanism that ever existed in OPEC is Saudi spare capacity and that power resides with a single member not the organization as a whole.
With enough spare capacity to be able to increase production sufficiently to offset the impact of lower prices on its own revenue, Saudi Arabia could enforce discipline by threatening to increase production enough to crash prices. In reality even this was not an OPEC enforcement mechanism unless OPEC's goals coincided with those of Saudi Arabia.
During the 1979-1980 period of rapidly increasing prices, Saudi Arabia's oil minister Ahmed Yamani repeatedly warned other members of OPEC that high prices would lead to a reduction in demand. His warnings fell on deaf ears. Surging prices caused several reactions among consumers: better insulation in new homes, increased insulation in many older homes, more energy efficiency in industrial processes, and automobiles with higher efficiency. These factors along with a global recession caused a reduction in demand which led to lower crude prices.
Unfortunately for OPEC only the global recession was temporary. Nobody rushed to remove insulation from their homes or to replace energy efficient equipment and factories -- much of the reaction to the oil price increase of the end of the decade was permanent and would never respond to lower prices with increased consumption of oil.
Higher prices in the late 1970s also resulted in increased exploration and production outside of OPEC. From 1980 to 1986 non-OPEC production increased 6 million barrels per day. Despite lower oil prices during that period new discoveries made in the 1970s continued to come online.
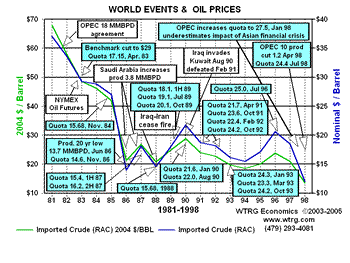
OPEC was faced with lower demand and higher supply from outside the organization. From 1982 to 1985, OPEC attempted to set production quotas low enough to stabilize prices. These attempts resulted in repeated failure, as various members of OPEC produced beyond their quotas. During most of this period Saudi Arabia acted as the swing producer cutting its production in an attempt to stem the free fall in prices. In August 1985, the Saudis tired of this role. They linked their oil price to the spot market for crude and by early 1986 increased production from two million barrels per day to five million. Crude oil prices plummeted falling below $10 per barrel by mid-1986. Despite the fall in prices Saudi revenue remained about the same with higher volumes compensating for lower prices.
A December 1986 OPEC price accord set to target $18 per barrel, but it was already breaking down by January of 1987 and prices remained weak.
The price of crude oil spiked in 1990 with the lower production, uncertainty associated with the Iraqi invasion of Kuwait and the ensuing Gulf War. The world and particularly the Middle East had a much harsher view of Saddam Hussein invading Arab Kuwait than they did Persian Iran. The proximity to the world's largest oil producer helped to shape the reaction.
Click on graph for larger view
U.S. Petroleum
Consumption
Click on graph
for larger view
Non-OPEC Production & Crude Oil Prices

Click on graph
for larger view
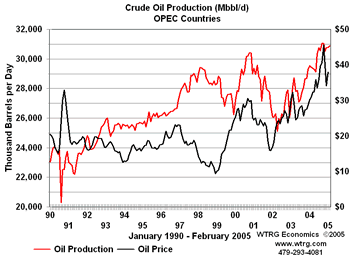
OPEC Production & Crude Oil Prices

Click on graph
for larger view
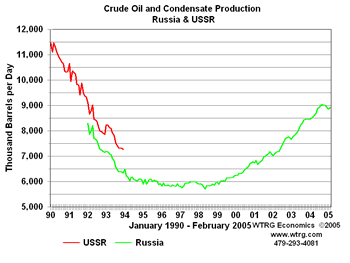
The price cycle then turned up. The United States economy was strong and the Asian Pacific region was booming. From 1990 to 1997, world oil consumption increased 6.2 million barrels per day. Asian consumption accounted for all but 300,000 barrels per day of that gain and contributed to a price recovery that extended into 1997. Declining Russian production contributed to the price recovery. Between 1990 and 1996 Russian production declined more than five million barrels per day.
Russian Crude Oil Production
Click on graph for larger view
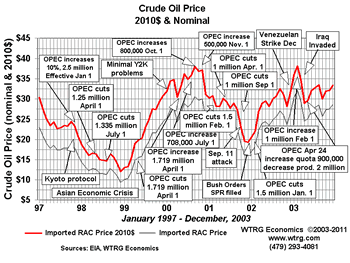
The price increases came to a rapid end in 1997 and 1998 when the impact of the economic crisis in Asia was either ignored or underestimated by OPEC. In December 1997, OPEC increased its quota by 2.5 million barrels per day (10 percent) to 27.5 million barrels per day effective January 1, 1998. The rapid growth in Asian economies came to a halt. In 1998, Asian Pacific oil consumption declined for the first time since 1982. The combination of lower consumption and higher OPEC production sent prices into a downward spiral. In response, OPEC cut quotas by 1.25 million barrels per day in April and another 1.335 million in July. The price continued down through December 1998.
Prices began to recover in early 1999. In April, OPEC reduced production by another 1.719 million barrels. As usual not all of the quotas were observed, but between early 1998 and the middle of 1999 OPEC production dropped by about three million barrels per day. The cuts were sufficient to move prices above $25 per barrel.
With minimal Y2K problems and growing U.S. and world economies, the price continued to rise throughout 2000 to a post 1981 high. In 2000 between April and October, three successive OPEC quota increases totaling 3.2 million barrels per day were not able to stem the price increase. Prices finally started down following another quota increase of 500,000 effective November 1, 2000.
OPEC Production
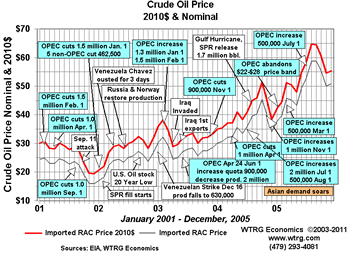
Once again it appeared that OPEC overshot the mark. In 2001, a weakened US economy and increases in non-OPEC production put downward pressure on prices. In response OPEC once again entered into a series of reductions in member quotas cutting 3.5 million barrels by September 1, 2001. In the absence of the September 11, 2001 terrorist attacks, this would have been sufficient to moderate or even reverse the downward trend.
In the wake of the attack, crude oil prices plummeted. Spot prices for the U.S. benchmark West Texas Intermediate were down 35 percent by the middle of November. Under normal circumstances a drop in price of this magnitude would have resulted in another round of quota reductions. Given the political climate OPEC delayed additional cuts until January 2002. It then reduced its quota by 1.5 million barrels per day and was joined by several non-OPEC producers including Russia which promised combined production cuts of an additional 462,500 barrels. This had the desired effect with oil prices moving into the $25 range by March 2002. By midyear the non-OPEC members were restoring their production cuts but prices continued to rise as U.S. inventories reached a 20-year low later in the year.
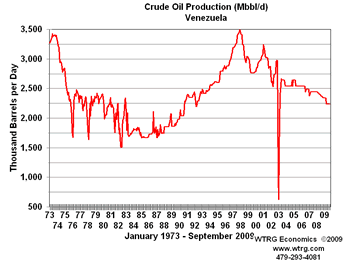
By year end oversupply was not a problem. Problems in Venezuela led to a strike at PDVSA causing Venezuelan production to plummet. In the wake of the strike Venezuela was never able to restore capacity to its previous level and is still about 900,000 barrels per day below its peak capacity of 3.5 million barrels per day. OPEC increased quotas by 2.8 million barrels per day in January and February 2003.
On March 19, 2003, just as some Venezuelan production was beginning to return, military action commenced in Iraq. Meanwhile, inventories remained low in the U.S. and other OECD countries. With an improving economy U.S. demand was increasing and Asian demand for crude oil was growing at a rapid pace.
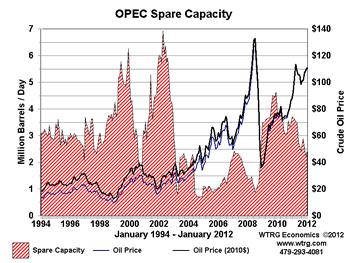
The loss of production capacity in Iraq and Venezuela combined with increased OPEC production to meet growing international demand led to the erosion of excess oil production capacity. In mid 2002, there were more than six million barrels per day of excess production capacity and by mid-2003 the excess was below two million. During much of 2004 and 2005 the spare capacity to produce oil was less than a million barrels per day. A million barrels per day is not enough spare capacity to cover an interruption of supply from most OPEC producers.
In a world that consumes more than 80 million barrels per day of petroleum products that added a significant risk premium to crude oil price and was largely responsible for prices in excess of $40-$50 per barrel.
Other major factors contributing to higher prices included a weak dollar and the rapid growth in Asian economies and their petroleum consumption. The 2005 hurricanes and U.S. refinery problems associated with the conversion from MTBE to ethanol as a gasoline additive also contributed to higher prices.
Russian Crude Oil Production
Venezuelan Oil Production
Click on graph for larger view
Excess Crude Oil Production Capacity
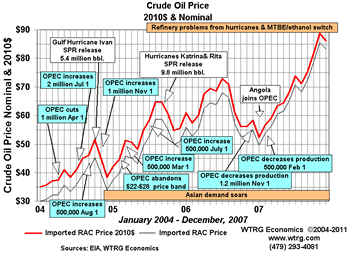
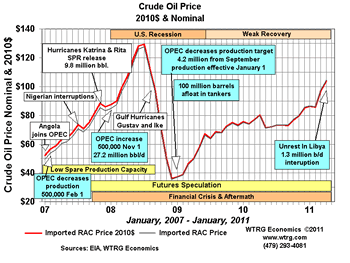
In 2008, after the beginning of the longest U.S. recession since the Great Depression the oil price continued to soar. Spare capacity dipped below a million barrels per day and speculation in the crude oil futures market was exceptionally strong. Trading on NYMEX closed at a record $145.29 on July 3, 2008. In the face of recession and falling petroleum demand the price fell throughout the remainder of the year to the below $40 in December.

Following an OPEC cut of 4.2 million b/d in January 2009 prices rose steadily in the supported by rising demand in Asia. In late February 2011, prices jumped as a consequence of the loss of Libyan exports in the face of the Libyan civil war. Concern about additional interruptions from unrest in other Middle East and North African producers continues to support the price while as of Mid-October 400,000 barrels per day of Libyan production was restored.
While speculation in the futures market was certainly a component of price increases over the last decade, research has yet to provide incontrovertible evidence that it was a major driver of prices. Over the last decade the number of futures contracts on NYMEX increased at over ten times the rate of increase of world petroleum consumption. In recent years, the ICE Brent contracts grew at a higher rate than NYMEX.
A NYMEX futures contract is a contract to deliver 1,000 barrels of light sweet crude oil in a certain month to the buyer at Cushing, Oklahoma. There is a direct link between futures prices and the cash price at Cushing. We will illustrate with an example. A producer of crude oil is offered $80 per barrel for 1,000 barrel of oil today. The same producer sees that the futures contract for delivery next month is trading at $85 dollars. Instead of selling at $80 to the refiner the producer could sell a futures contract for delivery next month at $85, store the 1,000 barrels for a month and be $5 better off less the cost of a months storage. The refiner needing the 1,000 barrels of crude today is then in the position that he must offer the producer something closer to the $85 NYMEX price to obtain the crude.
Historically, the price of NYMEX crude typically traded near the Brent price with a small premium. Since late 2010, Brent and NYMEX prices have diverged with West Texas Intermediate at Cushing, Oklahoma selling often selling more than $20 below Brent and other comparable crude oil. While continually quoted in the U.S. media as the oil price, oil at Cushing is not currently representative of world oil prices. The reason for the discount is high stocks of oil at Cushing with a limited number of refiners that can be served by pipelines out of Cushing.
Additional oil from Canada and the Bakken formation in North Dakota caused the local supply to exceed demand of the refiners served by pipelines out of Cushing. This resulted in oil stocks to building to 1.5 - 2.0 times the normal level. High stocks at Cushing depressed the local price, but not the price internationally. A return to the normal price relationship with WTI at a modest premium to Brent awaits improved pipeline access between Cushing and the refineries on the gulf of Mexico.


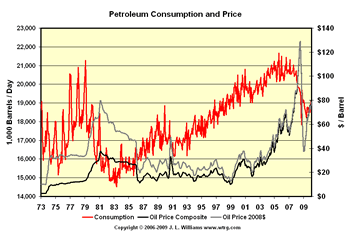
It is worth noting that the three longest U.S. recessions since the Great Depression coincided with exceptionally high oil prices. The first two lasted 16 months. The first followed the 1973 Embargo started in November 1973 and the second in July 1981. The latest began in December 2007 and lasted 18 months. Charts similar to the one at the right have been used to argue that price spikes and high oil prices cause recessions. There is little doubt that price is a major factor.
The same graph makes an even more compelling argument that recessions cause low oil prices.

[WTRG's HOME PAGE]
|
|
||
|
|
||
|
email WTRG at wtrg@wtrg.com |
||
